
![]() indicates when the first and/or main contributor(s) of the paper or the published study were directly funded by the RoadMap project
indicates when the first and/or main contributor(s) of the paper or the published study were directly funded by the RoadMap project
Several PhD thesis were carried out within the RoadMap project:
-
 Microphysical Characterization of Saltating Impacts and their Ejecta on the Martian Surface, T. Becker, UDE (expected defense early 2025)
 -
First analysis of the spectra obtained from the NOMAD instrument on-board ESA’s Trace Gas Orbiter, L. Trompet, BIRA-IASB (private defense: 24 Oct. 2023; public defense: 12 Dec. 2023)
-
Retrieving aerosol vertical distribution using solar occultation from the NOMAD instrument on-board ESA's Trace Gas Orbiter, Z. Flimon, BIRA-IASB (expected defense in Dec. 2025)
The following papers have been published under the umbrella of the Roadmap project:
![]() indicates when the first and/or main contributor(s) of the paper or the published study were directly funded by the RoadMap project
indicates when the first and/or main contributor(s) of the paper or the published study were directly funded by the RoadMap project
- 2023
-
Ejected Particles after Impact Splash on Mars: Aggregates and Aerodynamics, T. Becker, J. Teiser, T. Jardiel, M. Peiteado, O. Munoz, J. Martikainen, J. C. Gomez Martin, J. Merrison, and G. Wurm, Planetary Science Journal, 4:180 1-8, 2023.
-
Optical Constants of Martian Dust Analogues at UV-vis-NIR Wavelength, J. Martikainen, O. Muñoz, T. Jardiel, J. C. Gómez Martín, M. Peiteado, Y. Willame, A. Penttilä, K. Muinonen, G. Wurm, and T. Becker, Astrophysical Journal Supplement Series, 268:47 1-13, 2023.
-
Charged Atmospheric Aerosols from Charged Saltating Dust Aggregates, F. C. Onyeagusi, C. Meyer, J. Teiser, T. Becker, and G. Wurm, Atmosphere, 14:1065 1-10, 2023.
- Aeolian dust resuspension on Mars studied using a recirculating environmental wind tunnel, A. Waza, J. Kjer, M. Peiteado, T. Jardiel, J. Iversen, K. Rasmussen, J. Merrison, Planetary and Space Science 227 (2023) 105638, https://doi.org/10.1016/j.pss.2023.105638
- Water vapor vertical distribution on Mars during perihelion season of MY 34 and MY 35 with ExoMars-TGO/NOMAD observations, Brines et al., J. Geophys. Res. Planets (in press), e2022JE007273, https://doi.org/10.1029/2022JE007273 (2023)
- Martian Atmospheric Temperature and Density Profiles During the First Year of NOMAD/TGO Solar Occultation Measurements, Lopez-Valverde et al., J. Geophys. Res. Planets 128(2), e2022JE007278, https://doi.org/10.1029/2022JE007278 (2023)
- Depletion of 13C in CO in the Atmosphere of Mars Suggested by ExoMars-TGO/NOMAD Observations, Aoki et al., The Planetary Science Journal 4(5), 97, DOI 10.3847/PSJ/acd32f (2023)
- Martian Ozone Observed by TGO/NOMAD-UVIS Solar Occultation: An Inter-Comparison of Three Retrieval Methods, Piccialli et al., Earth and Space Science 10(2), e2022EA002429, https://doi.org/10.1029/2022EA002429 (2023)
- Carbon Dioxide Retrievals From NOMAD-SO on ESA's ExoMars Trace Gas Orbiter and Temperature Profiles Retrievals With the Hydrostatic Equilibrium Equation: 1. Description of the Method, Trompet et al., J. Geophys. Res. Planets 128(3), e2022JE007277, https://doi.org/10.1029/2022JE007279. (2023)
- Carbon dioxide retrievals from NOMAD-SO on ESA’s ExoMars Trace Gas Orbiter and temperature profiles retrievals with the hydrostatic equilibrium equation. 2. Temperature variabilities in the mesosphere at Mars terminator, Trompet et al., J. Geophys. Res. Planets 128(3), e2022JE007279, https://doi.org/10.1029/2022JE007279 (2023)
-
- 2022
- Global Vertical Distribution of Water Vapor on Mars: Results From 3.5 Years of ExoMars-TGO/NOMAD Science Operations, Aoki et al., JGR: Planets 127(9), e2022JE007231, https://doi.org/10.1029/2022JE007231 (2022)
- Releasing Atmospheric Martian Dust in Sand Grain Impacts, Becker et al., The Planetary Science Journal, DOI: 10.3847/PSJ/ac8477
- Collisional Charging in the Low Pressure Range of Protoplanetary Disks, Becker et al., Monthly Notices of the Royal Astronomical Society, DOI: 10.1093/mnras/stac1320
- Lifting of tribocharged grains by Martian winds, Kruss et al., Planetary Science Journal (2022) DOI: 10.3847/PSJ/ac38a4
- Planet-wide Ozone Destruction in the Middle Atmosphere on Mars during Global Dust Storm, Daerden et al., GRL (2022) https://doi.org/10.1029/2022GL098821
- The deuterium isotopic ratio of water released from the Martian caps as measured with TGO/NOMAD, Villanueva et al., GRL (2022) https://doi.org/10.1029/2022GL098161
- Vertical aerosol distribution and mesospheric clouds from ExoMars UVIS, Streeter et al., J. Geopphys. Res. Planets 127(5), e2021JE007065 (2022)
- Explaining NOMAD D/H observations by cloud-induced fractionation of water vapor on Mars, Daerden et al., J. Geopphys. Res. Planets 127(2), e2021JE007079 (2022)
- Aggregation of sub-mm particles in strong electric fields under microgravity conditions, Jungmann et al., Icarus 373, 114766 (2022)
- 2021
- ExoMars TGO/NOMAD-UVIS Vertical Profiles of Ozone: 1. Seasonal Variation and Comparison to Water , Patel et al.,J. Geopphys. Res. Planets 126(11), e2021JE006837 (2021)
- ExoMars TGO/NOMAD-UVIS vertical profiles of ozone: Part 2: The high-altitude layers of atmospheric ozone, Khayat et al., J. Geopphys. Res. Planets 126(11), e2021JE006834 (2021)
- First Detection and Thermal Characterization of Terminator CO2 Ice Clouds With ExoMars/NOMAD, Liuzzi et al., Geophys. Res. Letters 48(22), e2021GL095895 (2021)
- A Global and Seasonal Perspective of Martian Water Vapor From ExoMars/NOMAD, Crismani et al., J. Geopphys. Res. Planets 126(11), e2021JE006878(2021)
- Spectroscopic exploration of the Solar System, Vandaele A.C., The Innovation Platform 7, 82-83 (2021)
- Our first paper has been published in the First Issue of the brand new Europlanet Magazine !, Vandaele A.C., Europlanet Magazine 1, 24-25 (2021)
The following papers address topics which are related to the Roadmap project:
- A Comprehensive Database of the Optical Properties of Irregular Aerosol Particles for Radiative Transfer Simulations. Saito, M., et al., J. Atmospheric Sciences 78, 2089-2111 (2021)
Planet. Sci. J. 2 238 DOI 10.3847/PSJ/ac38a4 10.3847/PSJ/ac38a4
Kruss M., Salzmann T., Parteli E., Jungmann F., Teiser J., Schönau L., Wurm G.
It is a long-standing open question whether electrification of wind-blown sand due to tribocharging—the generation of electric charges on the surface of sand grains by particle–particle collisions—could affect rates of sand transport occurrence on Mars substantially. While previous wind tunnel experiments and numerical simulations addressed how particle trajectories may be affected by external electric fields, the effect of sand electrification remains uncertain. Here we show, by means of wind tunnel simulations under air pressure of 20 mbar, that the presence of electric charges on the particle surface can reduce the minimal threshold wind shear velocity for the initiation of sand transport, u*ft, significantly. In our experiments, we considered different samples, a model system of glass beads as well as a Martian soil analog, and different scenarios of triboelectrification. Furthermore, we present a model to explain the values of u*ft obtained in the wind tunnel that is based on inhomogeneously distributed surface charges. Our results imply that particle transport that subsides, once the wind shear velocity has fallen below the threshold for sustained transport, can more easily be restarted on Mars than previously thought.
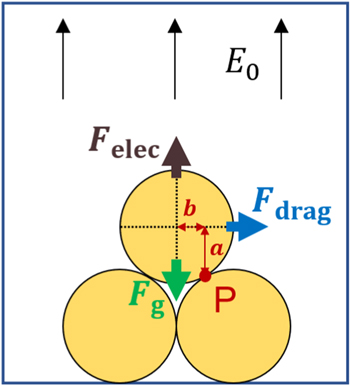
Schematical diagram of the main relevant forces acting on a particle that is protruding from the granular bed considered in our experiments.
Astrophysical Journal Supplement Series (2023); http://dx.doi.org/10.3847/1538-4365/acf0be
J. Martikainen, O. Muñoz, T. Jardiel, J. C. Gómez Martín, M. Peiteado, Y. Willame, A. Penttilä, K. Muinonen, G. Wurm, and T. Becker
We present an advanced light-scattering model to retrieve the optical constants of three Martian dust analogs: Johnson Space Center regolith simulant, Enhanced Mojave Mars Simulant, and Mars Global Simulant. The samples are prepared to have narrow particle-size distributions within the geometric-optics domain. We carry out laboratory measurements to obtain the particle-size distributions, shapes, and diffuse reflectance spectra of the Martian analogs deposited on a surface. Our model framework includes a ray-optics code to compute scattering properties for individual particles, and a radiative-transfer treatment to simulate the surface. The irregular shapes of the dust particles are taken into account in the model. We compare our derived imaginary parts of the refractive indices with those in the literature and find that they are much smaller than the ones that are commonly used for Martian dust. A sensitivity study shows that the retrieved optical constants are sensitive to the particle shape, which needs to be accounted for in applications that use different shapes. Finally, the derived values are validated by using them to reproduce the reflectance spectrum of the Martian surface regolith as observed by the Nadir and Occultation for Mars Discovery instrument on board the ExoMars mission.
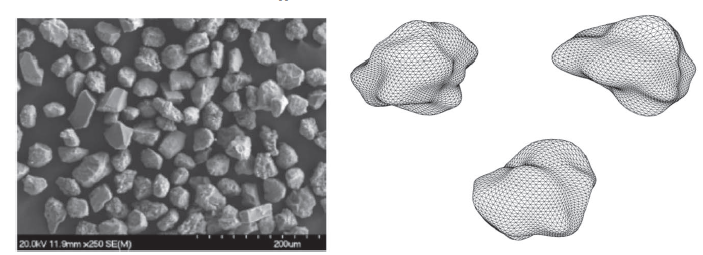
GRS1 particles used in the model (right) compared to the MMS-2 FESEM image (left).
Atmosphere (2023); https://doi.org/10.3390/atmos14071065
F. C. Onyeagusi, C. Meyer, J. Teiser, T. Becker, and G. Wurm
Grain collisions in aeolian events, e.g., due to saltation, result in atmospheric aerosols. They may regularly be electrically charged, but individual charge balances in collisions including small grains are not easily obtained on the ground. We therefore approach this problem in terms of microgravity, which allows for the observation of collisions and the determination of small charges. In a drop tower experiment, ∼1 mm dust aggregates are traced before and after a collision within the electric field of a plate capacitor. The sum of the electric charge of two particles (total charge) before and after the collision often strongly deviates from charge conservation. Due to the average low collision velocities of 0.2 m/s, there is no large scale fragmentation. However, we do observe small charged particles emerging from collisions. The smallest of these particles are as small as the current resolution limit of the optical system, i.e., they are at least as small as tens of µm. In the given setting, these small fragments may carry 1 nC/m2–1 µC/m2 which is between 1% and ten times the surface charge density of the large aggregates. These first experiments indicate that collisions of charged aggregates regularly shed charged grains into the atmosphere, likely down to the suspendable aerosol size.
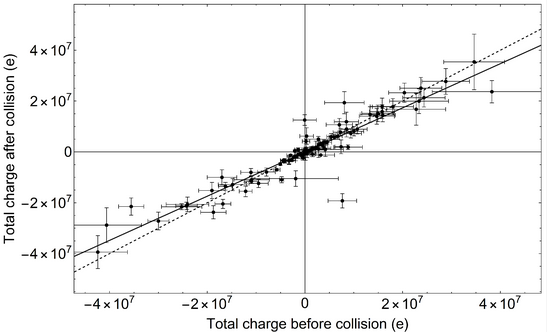
Total charge on two solid basalt spheres before and after a collision. The solid line is a linear approximation of the data. The dashed line visualizes charge conservation. The basalt bead systems tend to lose charge after a collision.
2023 (PSJ) https://doi.org/10.3847/PSJ/acd32f
S. Aoki, K. Shiobara, N. Yoshida, L. Trompet, T. Yoshida, N. Terada, H. Nakagawa, G. Liuzzi, A. C. Vandaele, I. R. Thomas
The atmosphere of Mars is mainly composed by carbon dioxide (CO2). It has been predicted that photodissociation of CO2 depletes 13C in carbon monoxide (CO). We present the carbon 13C/12C isotopic ratio in CO at 30–50 km altitude from the analysis of the solar occultation measurements taken by the instrument Nadir and Occultation for Mars Discovery on board the ExoMars Trace Gas Orbiter (ExoMars-TGO). We retrieve 12C16O, 13C16O, and 12C18O volume mixing ratios from the spectra taken at 4112–4213 cm−1, where multiple CO isotope lines with similar intensities are available. The intensities of the 12C16O lines in this spectral range are particularly sensitive to temperature, thus we derive the atmospheric temperature by retrieving CO2 density with simultaneously measured spectra at 2966–2990 cm−1. The mean δ13C value obtained from the 13C16O/12C16O ratios is −263‰, and the standard deviation and standard error of the mean are 132‰ and 4‰, respectively. The relatively large standard deviation is due to the strong temperature dependences in the 12C16O lines. We also examine the 13C16O/12C18O ratio, whose lines are less sensitive to temperature. The mean δ value obtained with 12C18O instead of 12C16O is −82‰ with smaller standard deviation, 60‰. These results suggest that CO is depleted in 13C when compared to CO2 in the Martian atmosphere as measured by the Curiosity rover. This depletion of 13C in CO is consistent with the CO2 photolysis-induced fractionation, which might support a CO-based photochemical origin of organics in Martian sediments.
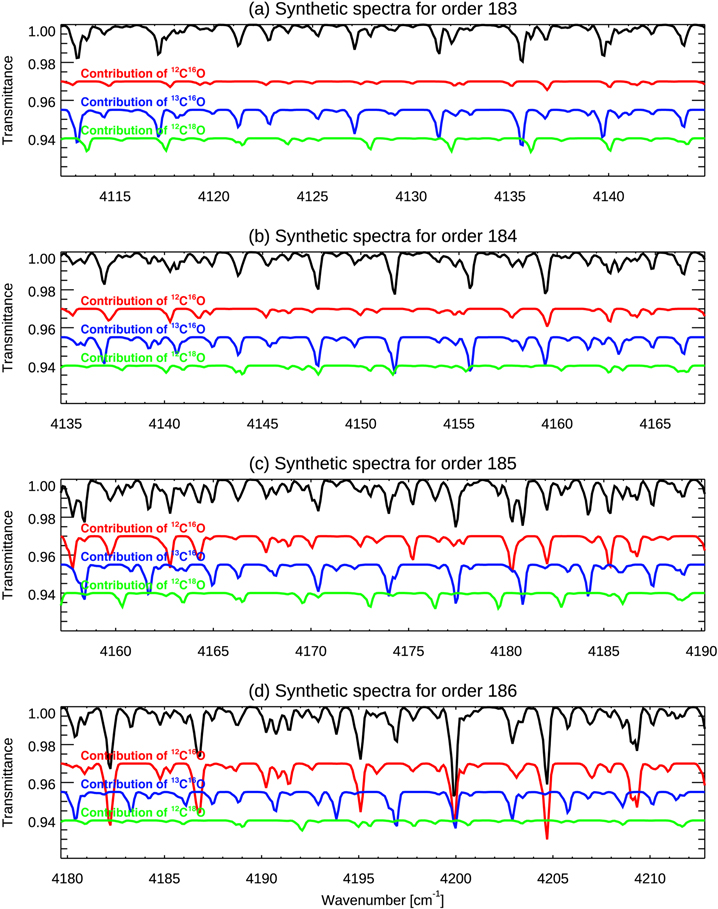
Synthetic spectra of the NOMAD measurements taken with diffraction order 183 (a), order 184 (b), order 185 (c), and order 186 (b) around 30 km tangent height. The assumed vertical profile of total CO volume mixing ratio is 1000 ppm (uniform) and along the line of sight. The isotopic ratios defined in the HITRAN2020 databases are assumed. The red, blue, and green curves illustrate contributions due to 12C16O, 13C16O, and 12C18O absorption lines. The origin of the Y-axis for the red, blue, and green curves have been offset to improve visibility.
Page 1 of 6
- You are here:
-
Home

- Publications