JGR Planets (2022) https://doi.org/10.1029/2021JE007079
F. Daerden, L. Neary, G. Villanueva, G. Liuzzi, S. Aoki, R. T. Clancy, J. A. Whiteway, B. J. Sandor, M. D. Smith, M. J. Wolff, A. Pankine, A. Khayat, R. Novak, B. Cantor, M. Crismani, M. J. Mumma, S. Viscardy, J. Erwin, C. Depiesse, A. Mahieux, A. Piccialli, S. Robert, L. Trompet, Y. Willame, E. Neefs, I. R. Thomas, B. Ristic, A. C. Vandaele
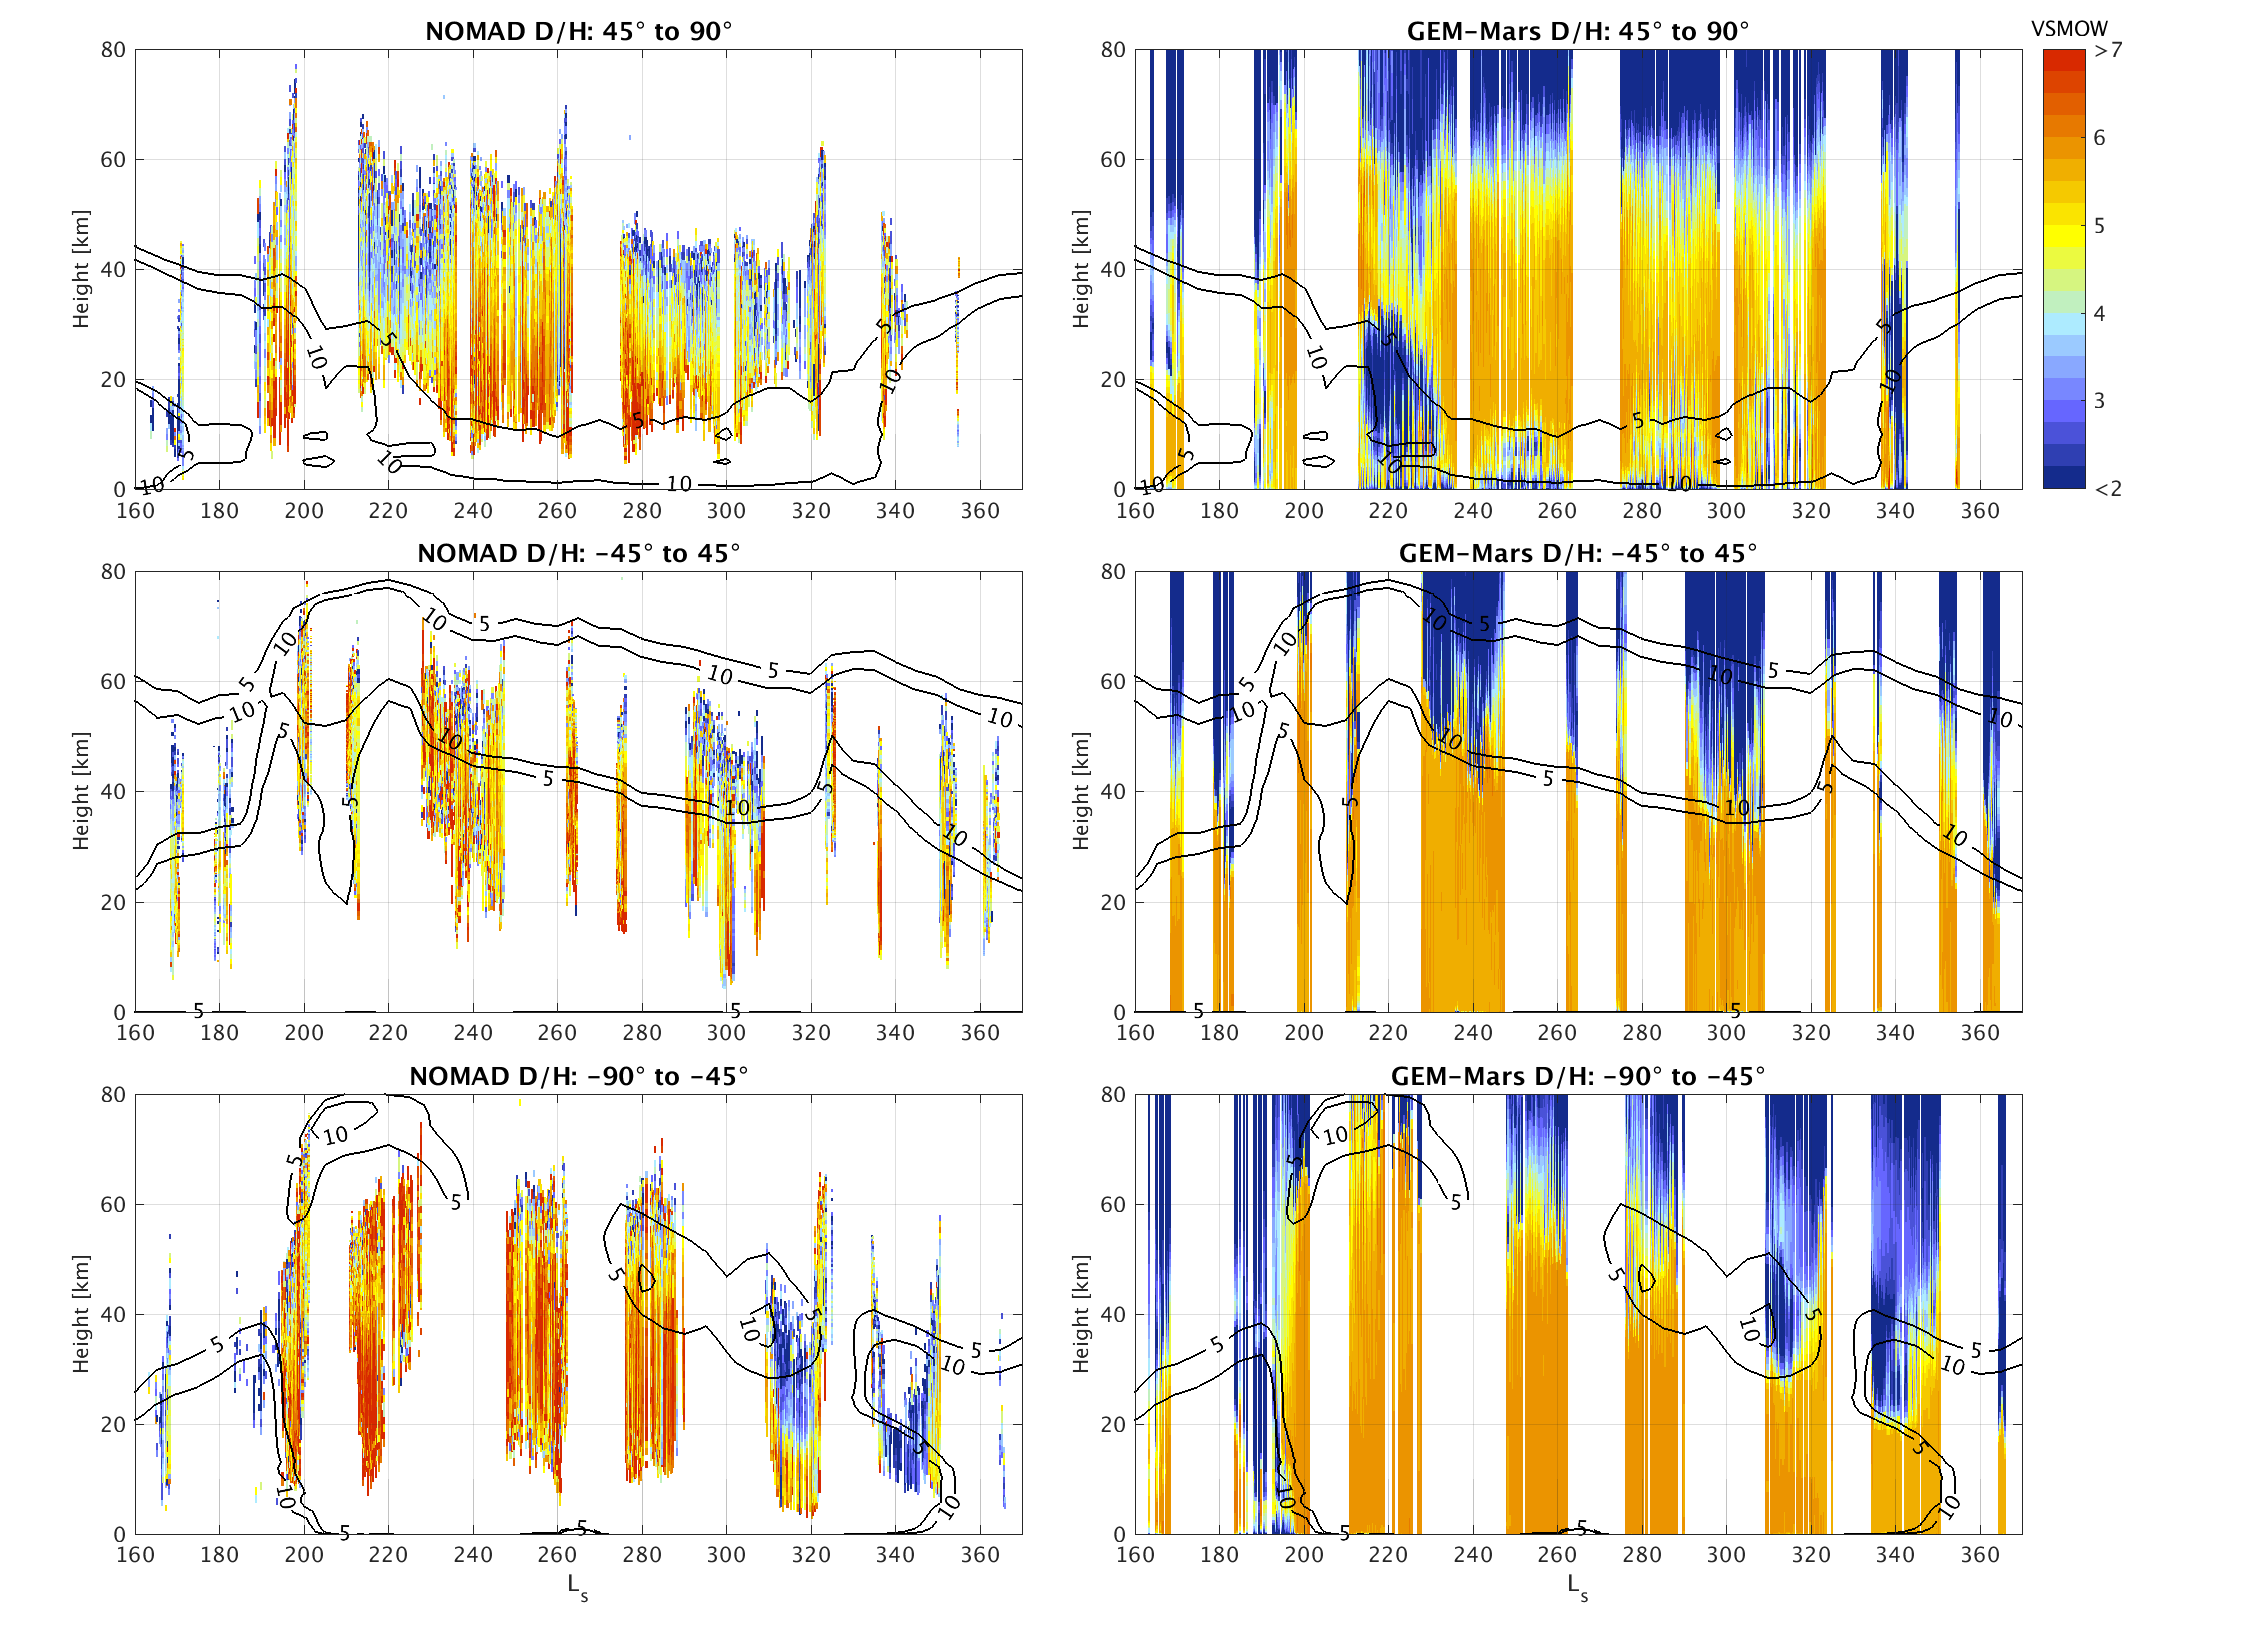
The vertical profiles of water vapor and its semi-heavy hydrogen isotope HDO provided by instruments on ExoMars Trace Gas Orbiter constitute a unique new data set to understand the Martian water cycle including its isotopic composition. As water vapor undergoes hydrogen isotopic fractionation upon deposition (but not sublimation), the D/H isotopic ratio in water is a tracer of phase transitions, and a key quantity to understand the long-term history of water on Mars. Here, we present 3D global simulations of D/H in water vapor and compare them to the vertically resolved observations of D/H and water ice clouds taken by NOMAD during the second half of Mars year 34. D/H is predicted to be constant with height up to the main cloud level, above which it drops because of strong fractionation, explaining the upper cut-off in the NOMAD observations when HDO drops below detectability. During the global and regional dust storms of 2018/2019, we find that HDO ascends with H2O, and that the D/H ratio is constant and detectable up to larger heights. The simulations are within the provided observational uncertainties over wide ranges in season, latitude and height. Our work provides evidence that the variability of the D/H ratio in the lower and middle atmosphere of Mars is controlled by fractionation on water ice clouds, and thus modulated by diurnally and seasonally varying cloud formation. We find no evidence of other processes or reservoirs that would have a significant impact on the D/H ratio in water vapor.

Overview of NOMAD D/H observations (left) and model simulations (right, MY34 simulation) in three wide latitude ranges. The simulation output was interpolated to the time and location of the observations. The black contour lines show the simulated zonal mean ice mass mixing ratio (in ppmm), averaged over the respective latitude ranges, over all local times and over 5° Ls.

