JGR Planets (2022) https://doi.org/10.1029/2021JE007065
Paul M. Streeter, Graham Sellers, Michael J. Wolff, Jonathon P. Mason, Manish R. Patel, Stephen R. Lewis, James A. Holmes, Frank Daerden, Ian R. Thomas, Bojan Ristic, Yannick Willame, Cédric Depiesse, Ann Carine Vandaele, Giancarlo Bellucci, José Juan López-Moreno
The vertical opacity structure of the martian atmosphere is important for understanding the distribution of ice (water and carbon dioxide) and dust. We present a new data set of extinction opacity profiles from the NOMAD/UVIS spectrometer aboard the ExoMars Trace Gas Orbiter, covering one and a half Mars Years (MY) including the MY 34 Global Dust Storm and several regional dust storms. We discuss specific mesospheric cloud features and compare with existing literature and a Mars Global Climate Model (MGCM) run with data assimilation. Mesospheric opacity features, interpreted to be water ice, were present during the global and regional dust events and correlate with an elevated hygropause in the MGCM, providing evidence that regional dust storms can boost transport of vapor to mesospheric altitudes (with potential implications for atmospheric escape). The season of the dust storms also had an apparent impact on the resulting lifetime of the cloud features, with events earlier in the dusty season correlating with longer-lasting mesospheric cloud layers. Mesospheric opacity features were also present during the dusty season even in the absence of regional dust storms, and interpreted to be water ice based on previous literature. The assimilated MGCM temperature structure agreed well with the UVIS opacities, but the MGCM opacity field struggled to reproduce mesospheric ice features, suggesting a need for further development of water ice parameterizations. The UVIS opacity data set offers opportunities for further research into the vertical aerosol structure of the martian atmosphere, and for validation of how this is represented in numerical models.
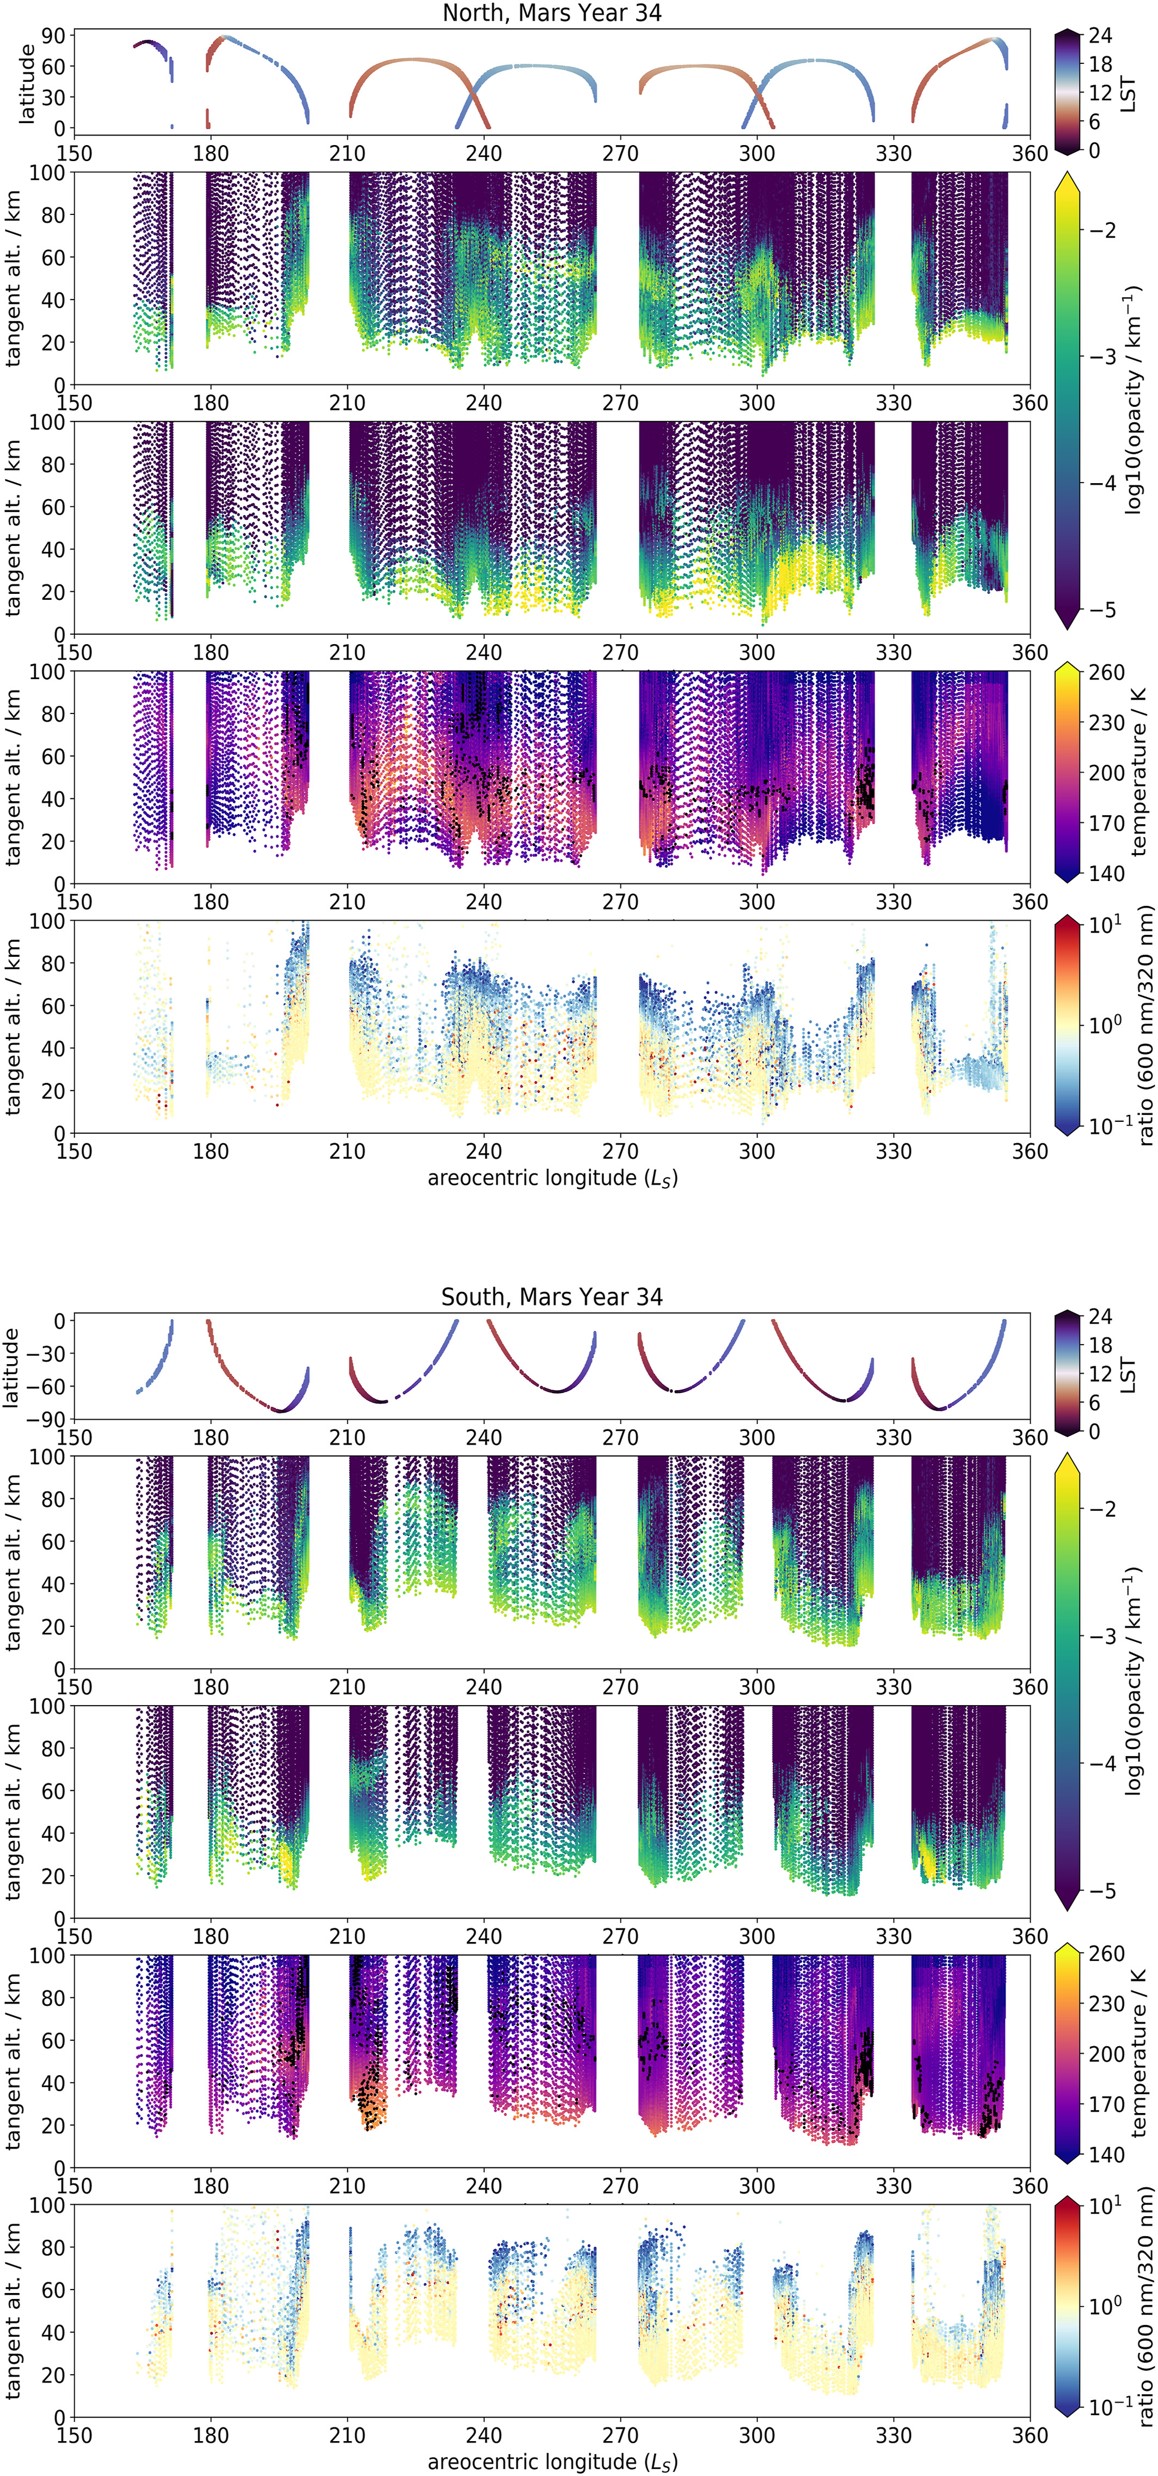
For MY 34 in the northern hemisphere (top five plots) and southern hemisphere (bottom five plots), from top to bottom: UVIS occultation latitude and local solar time distribution; UVIS occultation opacity profiles at 320–360 nm; total (dust + water ice) opacity profiles from the MGCM run with assimilation, matched to the same locations as the UVIS occultations; atmospheric temperatures from the MGCM run with assimilation, matched to the same locations as the UVIS occultations, and overlaid with black dots indicating the approximate location of the hygropause in the MGCM water vapor field, defined here as 70 ppmv (J. Holmes et al., 2021); ratio of UVIS occultation opacities at 600 nm over 320 nm.