https://doi.org/10.1029/2021JE006837
M. R. Patel, G. Sellers, J. P. Mason, J. A. Holmes, M. A. J. Brown, S. R. Lewis, K. Rajendran, P. M. Streeter, C. Marriner, B. G. Hathi, D. J. Slade, M. R. Leese, M. J. Wolff, A. S. J. Khayat, M. D. Smith, S. Aoki, A. Piccialli, A. C. Vandaele, S. Robert, F. Daerden, I. R. Thomas, B. Ristic, Y. Willame, C. Depiesse, G. Bellucci, J.-J. Lopez-Moreno
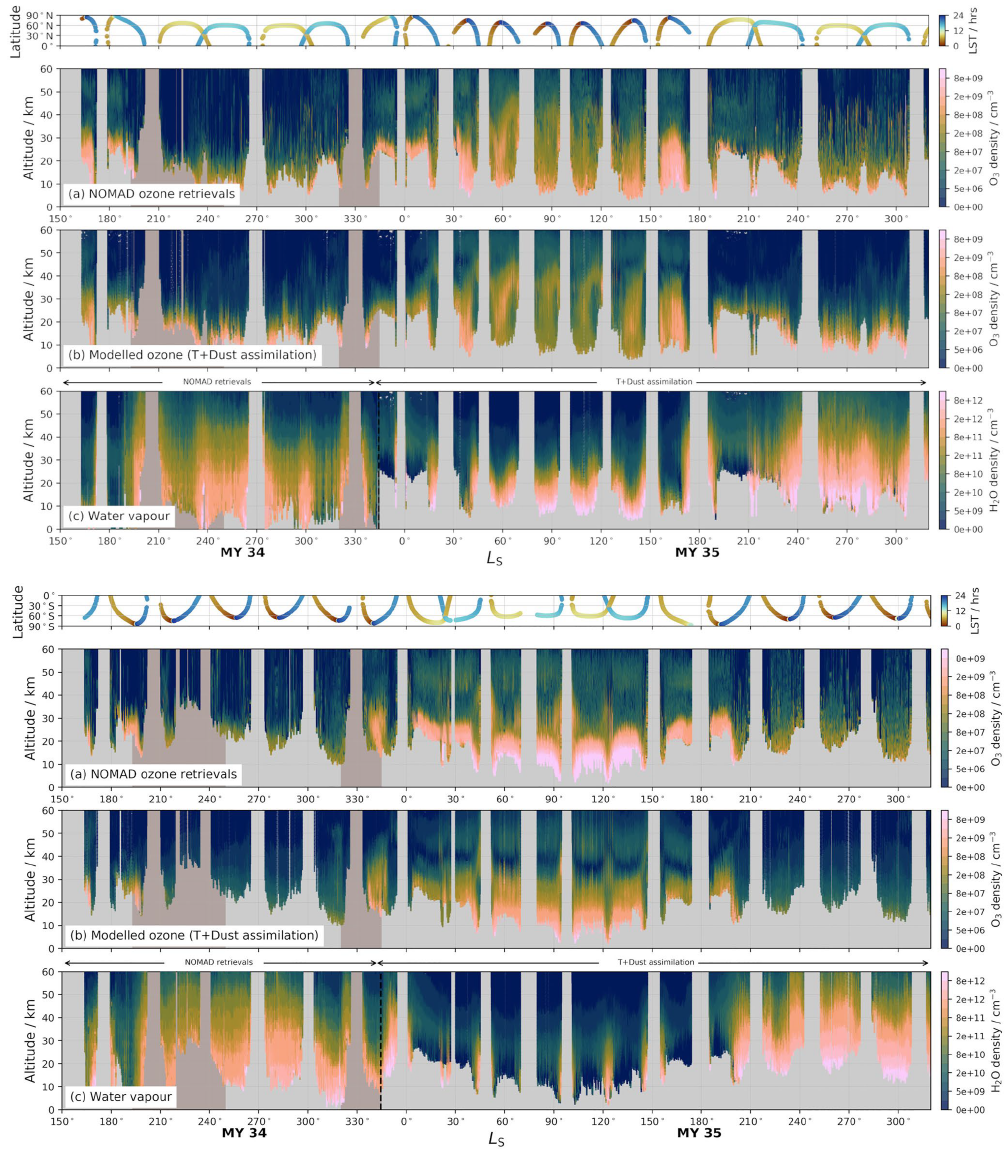
We present ∼1.5 Mars Years (MY) of ozone vertical profiles, covering LS = 163° in MY34 to LS = 320° in MY35, a period which includes the 2018 global dust storm. Since April 2018, the Ultraviolet and Visible Spectrometer channel of the Nadir and Occultation for Mars Discovery (NOMAD) instrument aboard the ExoMars Trace Gas Orbiter has observed the vertical, latitudinal and seasonal distributions of ozone. Around perihelion, the relative abundance of both ozone and water (from coincident NOMAD measurements) increases with decreasing altitude below ∼40 km. Around aphelion, localized decreases in ozone abundance exist between 25 and 35 km coincident with the location of modeled peak water abundances. High-latitude (>±55°), high altitude (40–55 km) equinoctial ozone enhancements are observed in both hemispheres (LS ∼350°–40°) and discussed in the companion article to this work (Khayat et al., 2021). The descending branch of the main Hadley cell shapes the observed ozone distribution at LS = 40°–60°, with the possible signature of a northern hemisphere thermally indirect cell identifiable from LS = 40°–80°. Morning terminator observations show elevated ozone abundances with respect to evening observations, with average ozone abundances between 20 and 40 km an order of magnitude higher at sunrise compared to sunset, attributed to diurnal photochemical partitioning along the line of sight between ozone and O or fluctuations in water abundance. The ozone retrievals presented here provide the most complete global description of Mars ozone vertical distributions to date as a function of season and latitude.