
https://doi.org/10.1029/2021GL095895
Giuliano Liuzzi, Geronimo L. Villanueva, Loïc Trompet,Matteo M. J. Crismani,Arianna Piccialli,Shohei Aoki,Miguel Angel Lopez-Valverde,Aurélien Stolzenbach,Frank Daerden,Lori Neary,Michael D. Smith,Manish R. Patel,Stephen R. Lewis,R. Todd Clancy,Ian R. Thomas,Bojan Ristic,Giancarlo Bellucci,Jose-Juan Lopez-Moreno, Ann Carine Vandaele
We present observations of terminator CO2 ice clouds events in three groups: Equatorial dawn, Equatorial dusk (both between 20°S and 20°N) and Southern midlatitudes at dawn (45°S and 55°S east of Hellas Basin) with ESA ExoMars Trace Gas Orbiter's Nadir and Occultation for MArs Discovery instrument. CO2 ice abundance is retrieved simultaneously with water ice, dust, and particle sizes, and rotational temperature and CO2 column profiles in 16 of 26 cases. Small particles (<0.5 μm) prevail at dusk, while water ice likely provides most source nuclei at dawn. Clouds east of Hellas are found to be dominantly nucleated on surface-lifted dust. CO2 ice is sometimes detected in unsaturated air together with dust nuclei at dawn, suggesting ongoing sublimation. Depending on latitude and local time, the interplay between particle precipitation and the lifetime of temperature minima (i.e., cold pockets) determines CO2 ice properties.
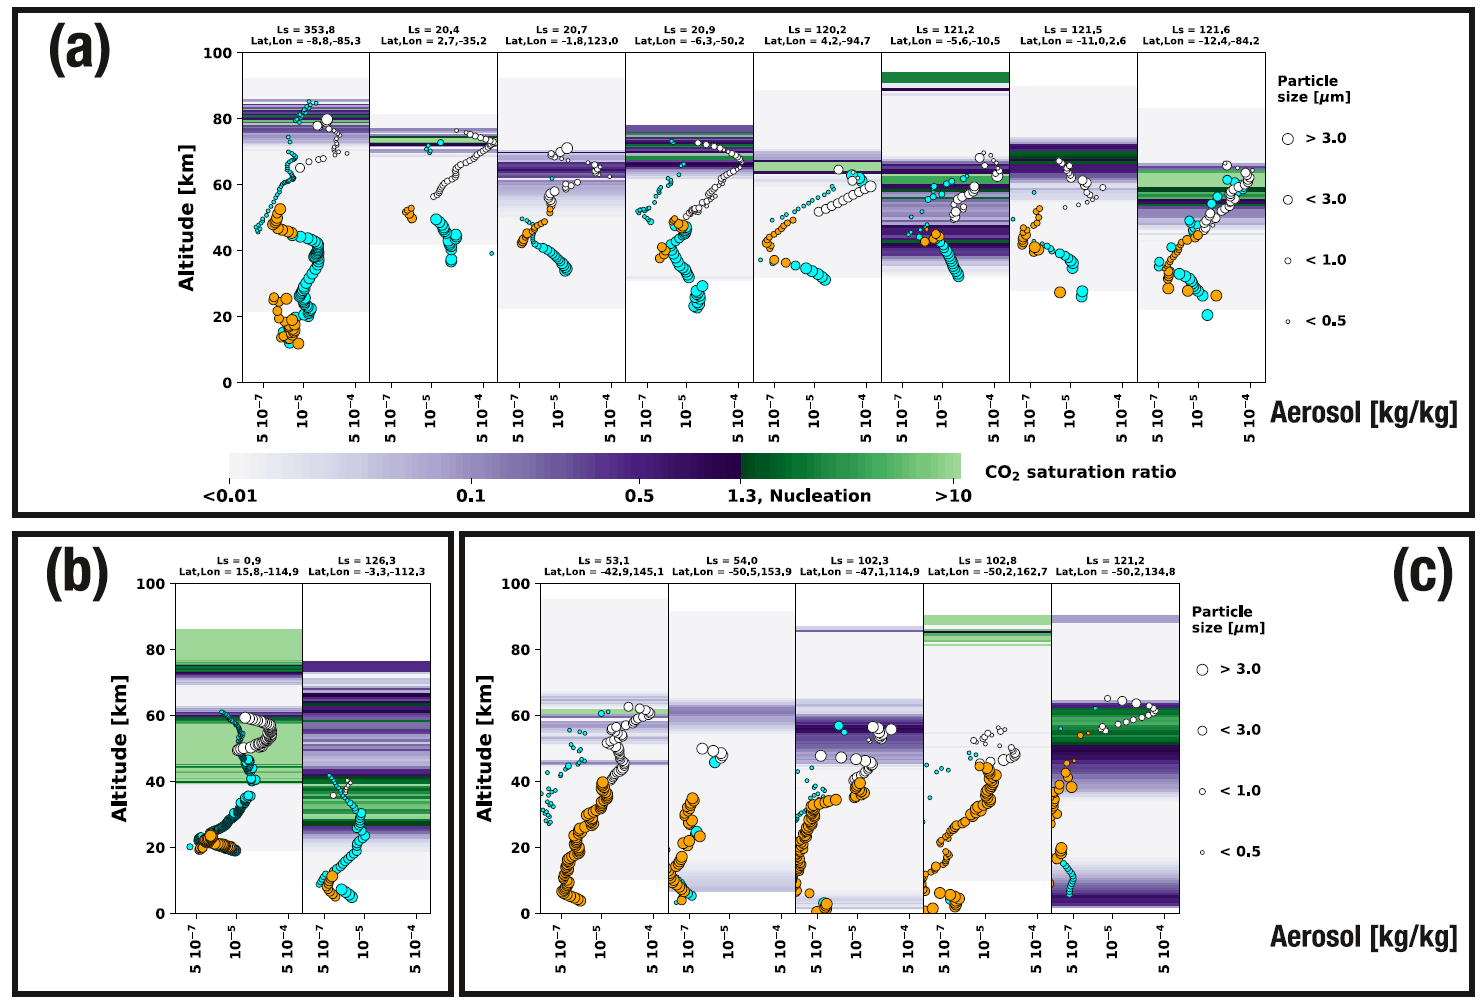
(a) Summary of the detections in the Equatorial region at dusk, dawn (b) and in the Hellas region at dawn (c). The plots report only the cases in which temperature (and CO2 saturation ratio, contours) is retrieved together with the properties of dust (orange dots), CO2 ice (white) and water ice (blue).
https://doi.org/10.1029/2021JE006834
Alain SJ. Khayat, Michael D. Smith, Michael Wolff, Frank Daerden, Lori Neary, Manish R. Patel, Arianna Piccialli, Ann C. Vandaele, Ian Thomas, Bojan Ristic, Jon Mason, Yannick Willame, Cedric Depiesse, Giancarlo Bellucci, José Juan López-Moreno.
Solar occultations performed by the Nadir and Occultation for MArs Discovery (NOMAD) ultraviolet and visible spectrometer (UVIS) onboard the ExoMars Trace Gas Orbiter (TGO) have provided a comprehensive mapping of atmospheric ozone density. The observations here extend over a full Mars year (MY) between April 21, 2018 at the beginning of the TGO science operations during late northern summer on Mars (MY 34, Ls = 163°) and March 9, 2020 (MY 35). UVIS provided transmittance spectra of the Martian atmosphere allowing measurements of the vertical distribution of ozone density using its Hartley absorption band (200 – 300 nm). The overall comparison to water vapor is found in the companion paper to this work (Patel et al., 2021). Our findings indicate the presence of (1) a high-altitude peak of ozone between 40 and 60 km in altitude over the north polar latitudes for at least 45 % of the Martian year during mid-northern spring, late northern summer-early southern spring, and late southern summer, and (2) a second, but more prominent, high-altitude ozone peak in the south polar latitudes, lasting for at least 60 % of the year including the southern autumn and winter seasons. When present, both high-altitude peaks are observed in the sunrise and sunset occultations, suggesting that the layers could persist during the day. Results from the Mars general circulation models predict the general behavior of these peaks of ozone and are used in an attempt to further our understanding of the chemical processes controlling high-altitude ozone on Mars.
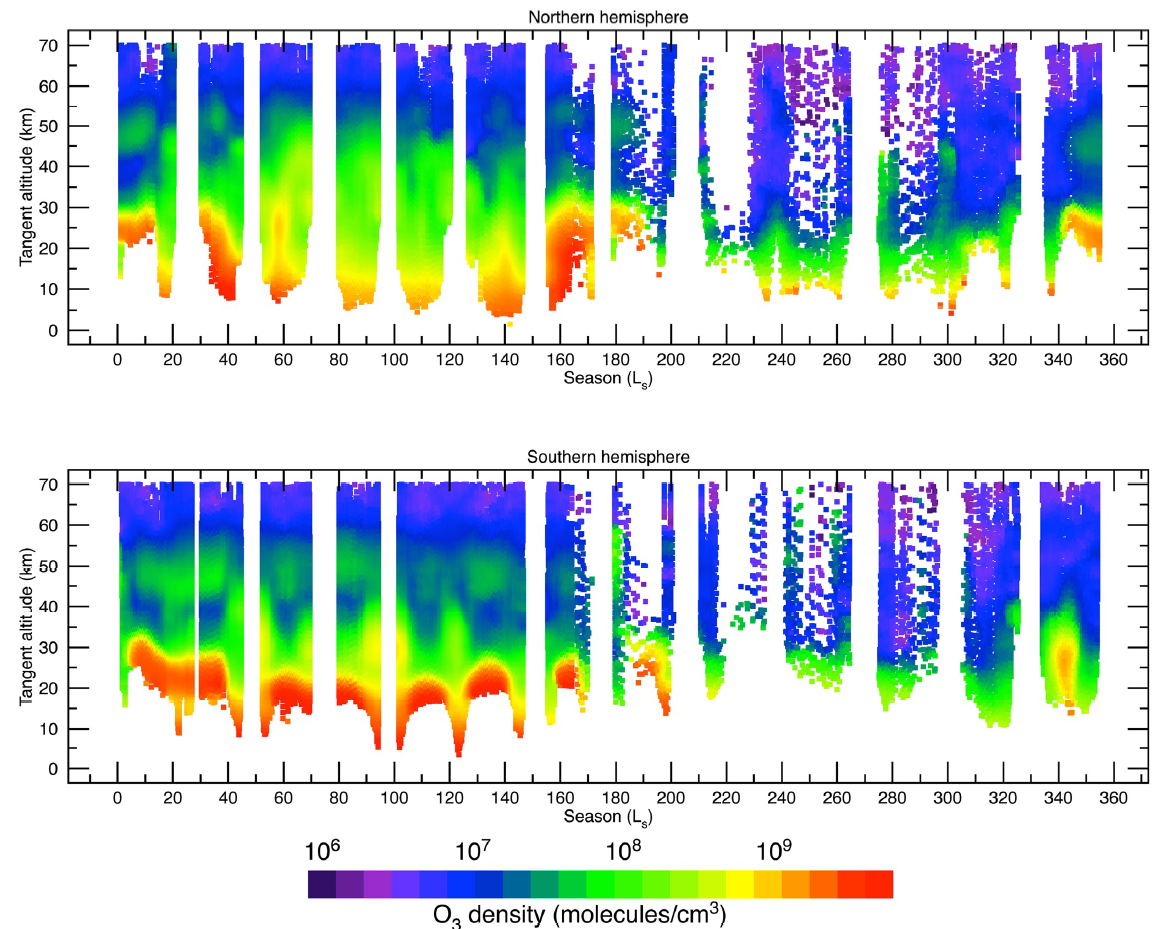
Seasonal distribution of the retrieved vertical O3 abundance (molecules/cm3) in the northern (upper panel) and southern (lower panel) hemispheres. The results are shown after applying a two-dimensional convolution of ∆Ls= 5 ° in the local time dimension (x axis) and ∆𝑧 = 3 km in the altitude dimension (y axis). The high-altitude peaks of ozone are visible in both hemispheres during northern spring (southern fall).
https://doi.org/10.1029/2021JE006878 http://oro.open.ac.uk/79769/2/Crismani%202021accepted.pdf
https://doi.org/10.1029/2021JE006837
M. R. Patel, G. Sellers, J. P. Mason, J. A. Holmes, M. A. J. Brown, S. R. Lewis, K. Rajendran, P. M. Streeter, C. Marriner, B. G. Hathi, D. J. Slade, M. R. Leese, M. J. Wolff, A. S. J. Khayat, M. D. Smith, S. Aoki, A. Piccialli, A. C. Vandaele, S. Robert, F. Daerden, I. R. Thomas, B. Ristic, Y. Willame, C. Depiesse, G. Bellucci, J.-J. Lopez-Moreno
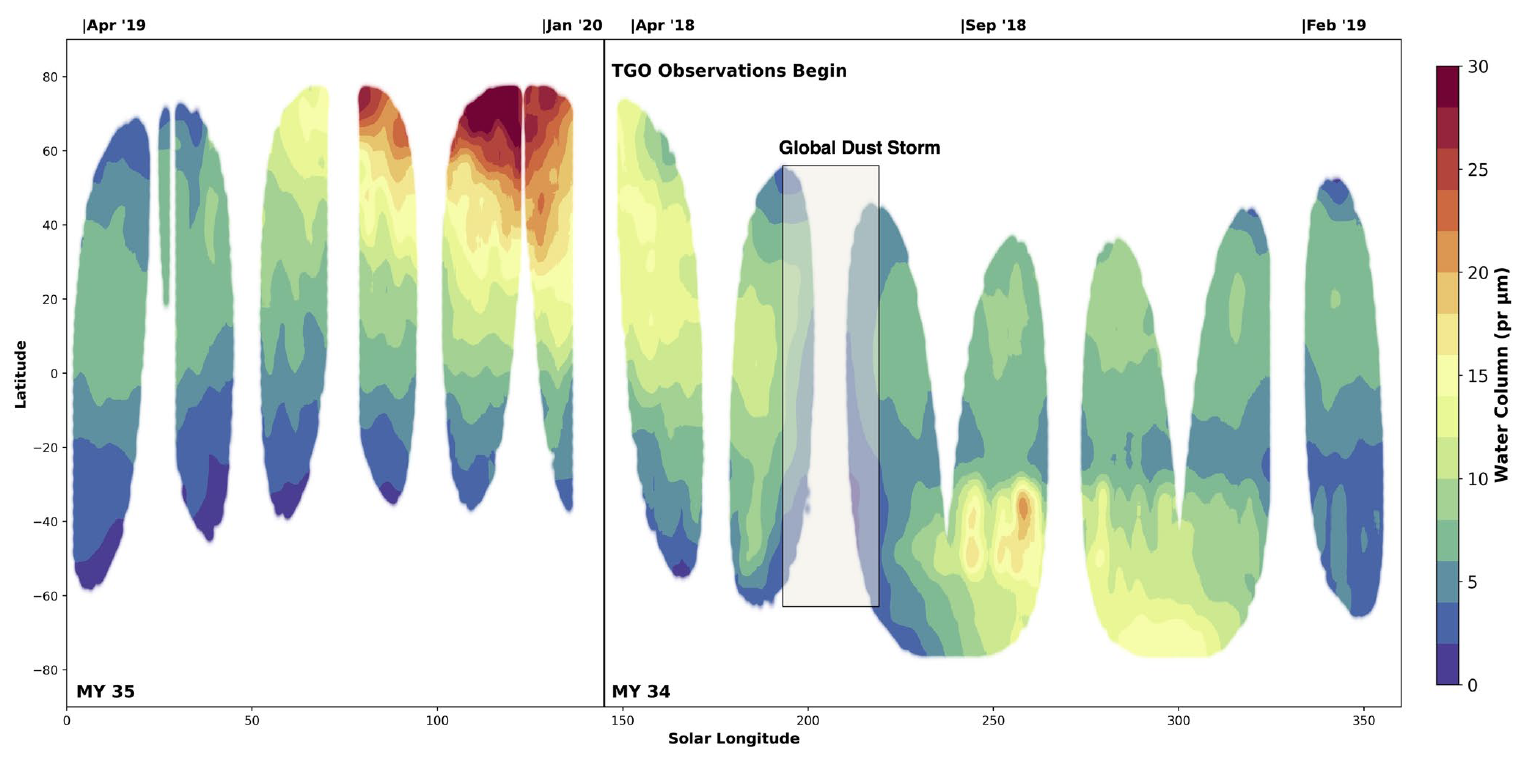
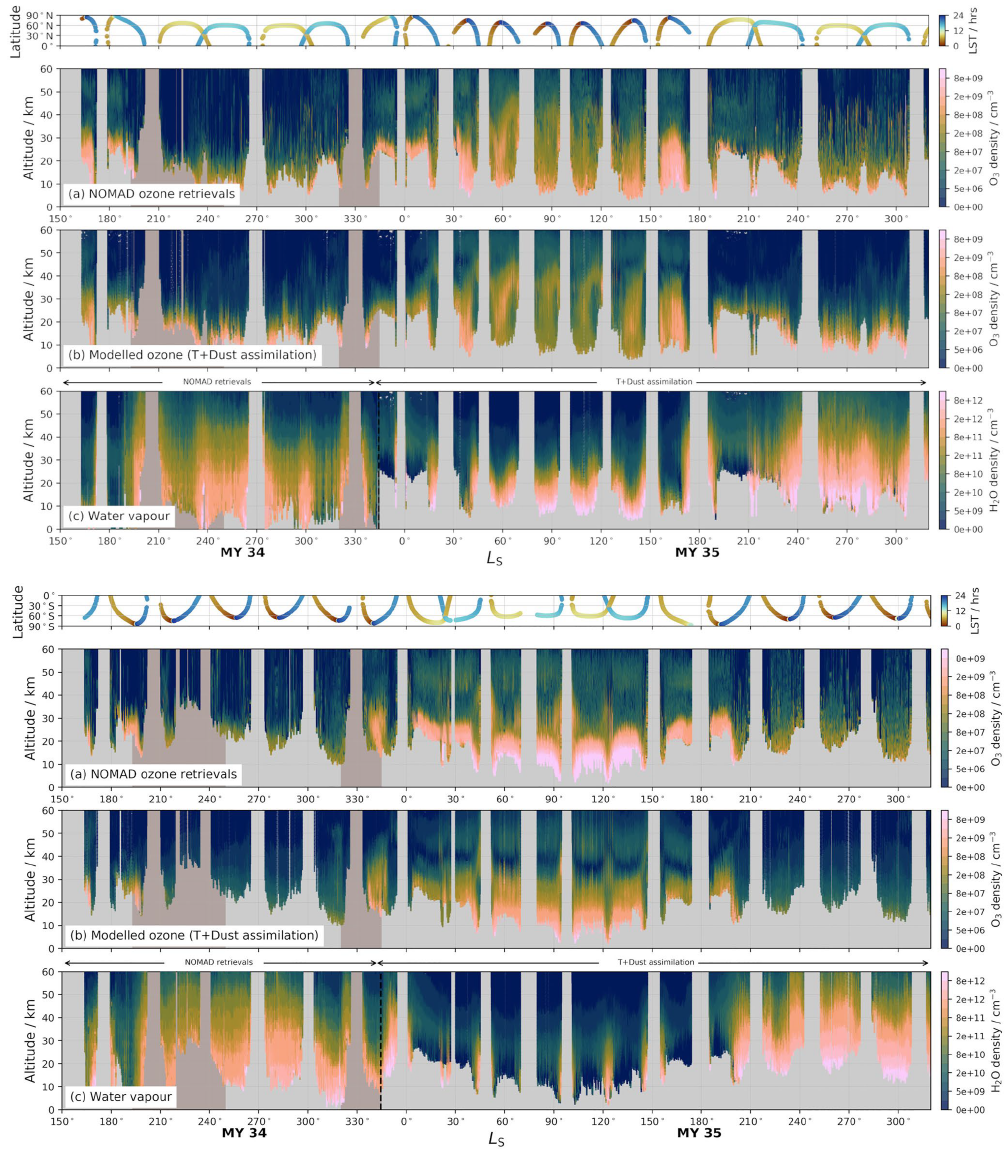
We present ∼1.5 Mars Years (MY) of ozone vertical profiles, covering LS = 163° in MY34 to LS = 320° in MY35, a period which includes the 2018 global dust storm. Since April 2018, the Ultraviolet and Visible Spectrometer channel of the Nadir and Occultation for Mars Discovery (NOMAD) instrument aboard the ExoMars Trace Gas Orbiter has observed the vertical, latitudinal and seasonal distributions of ozone. Around perihelion, the relative abundance of both ozone and water (from coincident NOMAD measurements) increases with decreasing altitude below ∼40 km. Around aphelion, localized decreases in ozone abundance exist between 25 and 35 km coincident with the location of modeled peak water abundances. High-latitude (>±55°), high altitude (40–55 km) equinoctial ozone enhancements are observed in both hemispheres (LS ∼350°–40°) and discussed in the companion article to this work (Khayat et al., 2021). The descending branch of the main Hadley cell shapes the observed ozone distribution at LS = 40°–60°, with the possible signature of a northern hemisphere thermally indirect cell identifiable from LS = 40°–80°. Morning terminator observations show elevated ozone abundances with respect to evening observations, with average ozone abundances between 20 and 40 km an order of magnitude higher at sunrise compared to sunset, attributed to diurnal photochemical partitioning along the line of sight between ozone and O or fluctuations in water abundance. The ozone retrievals presented here provide the most complete global description of Mars ozone vertical distributions to date as a function of season and latitude.
The RoadMap project is mentioned in a paper published by The Innovation Platform. It will be available in Issue7 of their Magazine.
The text is however already available on their web site, see here
Page 5 of 6
- You are here:
-
Home

- Publications