
GRL (2022) https://doi.org/10.1029/2022GL098821
F. Daerden, L. Neary, M. J. Wolff, R. T. Clancy, F. Lefèvre, J. A. Whiteway, S. Viscardy, A. Piccialli, Y. Willame, C. Depiesse, S. Aoki, I. R. Thomas, B. Ristic, J. Erwin, J.-C. Gérard, B. J. Sandor, A. Khayat, M. D. Smith, J. P. Mason, M. R. Patel, G. L. Villanueva, G. Liuzzi, G. Bellucci, J.-J. Lopez-Moreno, A. C. Vandaele
The NOMAD/UVIS spectrometer on the ExoMars Trace Gas Orbiter provided observations of ozone and water vapor in the global dust storm of 2018. Here we show in detail, using advanced data filtering and chemical modeling, how Martian ozone in the middle atmosphere was destroyed during the dust storm. In data taken exactly one year later when no dust storm occurred, the normal situation had been reestablished. The model simulates how water vapor is transported to high altitudes and latitudes in the storm, where it photolyses to form odd hydrogen species that catalyze ozone. Ozone destruction is simulated at all latitudes and up to 100 km, except near the surface where it increases. The simulations also predict a strong increase in the photochemical production of atomic hydrogen in the middle atmosphere, consistent with the enhanced hydrogen escape observed in the upper atmosphere during global dust storms.
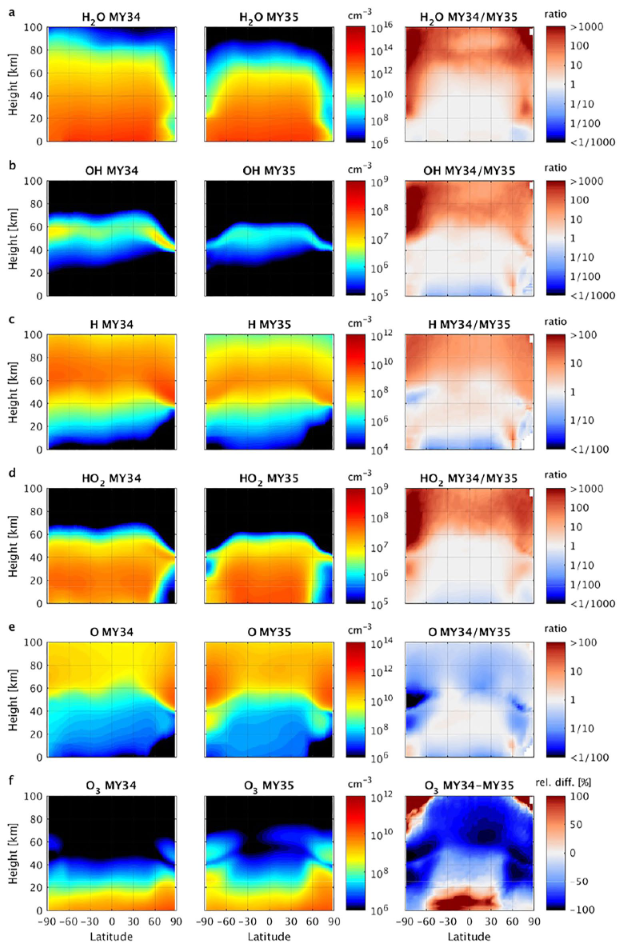
Latitude-height cross-sections of the simulated number densities of H2O, OH, H, HO2, O and O3 for MY34 (left column) and MY35 (center column), averaged over Ls = 210°–220° (period which falls in the global dust storm (GDS) in MY34). The right column show the ratio of the averaged number densities in MY34 and MY35, except for O3 for which the relative difference is shown. The densities from both years were first interpolated to a common altitude grid as the atmospheric height scale changed during the GDS.
GRL (2022) https://doi.org/10.1029/2022GL098161
Geronimo L. Villanueva, Giuliano Liuzzi, Shohei Aoki, Shane W. Stone, Adrian Brines, Ian R. Thomas, Miguel Angel Lopez-Valverde, Loic Trompet, Justin Erwin, Frank Daerden, Bojan Ristic, Michael D. Smith, Michael J. Mumma, Sara Faggi, Vincent Kofman, Séverine Robert, Lori Neary, Manish Patel, Giancarlo Bellucci, J.-J. Lopez-Moreno, Ann Carine Vandaele
JGR Planets (2022) https://doi.org/10.1029/2021JE007079
F. Daerden, L. Neary, G. Villanueva, G. Liuzzi, S. Aoki, R. T. Clancy, J. A. Whiteway, B. J. Sandor, M. D. Smith, M. J. Wolff, A. Pankine, A. Khayat, R. Novak, B. Cantor, M. Crismani, M. J. Mumma, S. Viscardy, J. Erwin, C. Depiesse, A. Mahieux, A. Piccialli, S. Robert, L. Trompet, Y. Willame, E. Neefs, I. R. Thomas, B. Ristic, A. C. Vandaele
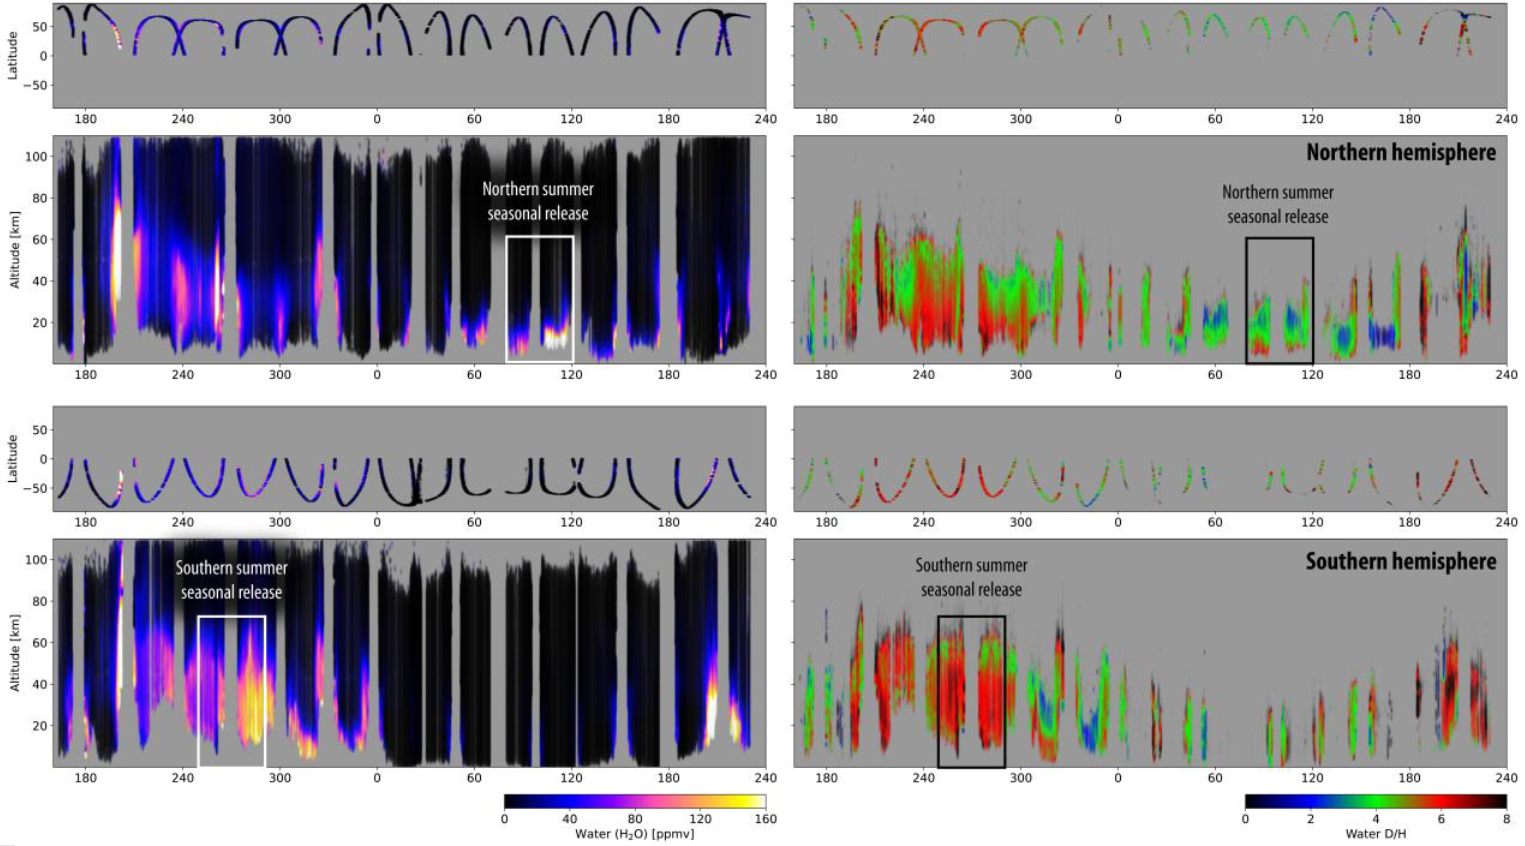
The vertical profiles of water vapor and its semi-heavy hydrogen isotope HDO provided by instruments on ExoMars Trace Gas Orbiter constitute a unique new data set to understand the Martian water cycle including its isotopic composition. As water vapor undergoes hydrogen isotopic fractionation upon deposition (but not sublimation), the D/H isotopic ratio in water is a tracer of phase transitions, and a key quantity to understand the long-term history of water on Mars. Here, we present 3D global simulations of D/H in water vapor and compare them to the vertically resolved observations of D/H and water ice clouds taken by NOMAD during the second half of Mars year 34. D/H is predicted to be constant with height up to the main cloud level, above which it drops because of strong fractionation, explaining the upper cut-off in the NOMAD observations when HDO drops below detectability. During the global and regional dust storms of 2018/2019, we find that HDO ascends with H2O, and that the D/H ratio is constant and detectable up to larger heights. The simulations are within the provided observational uncertainties over wide ranges in season, latitude and height. Our work provides evidence that the variability of the D/H ratio in the lower and middle atmosphere of Mars is controlled by fractionation on water ice clouds, and thus modulated by diurnally and seasonally varying cloud formation. We find no evidence of other processes or reservoirs that would have a significant impact on the D/H ratio in water vapor.
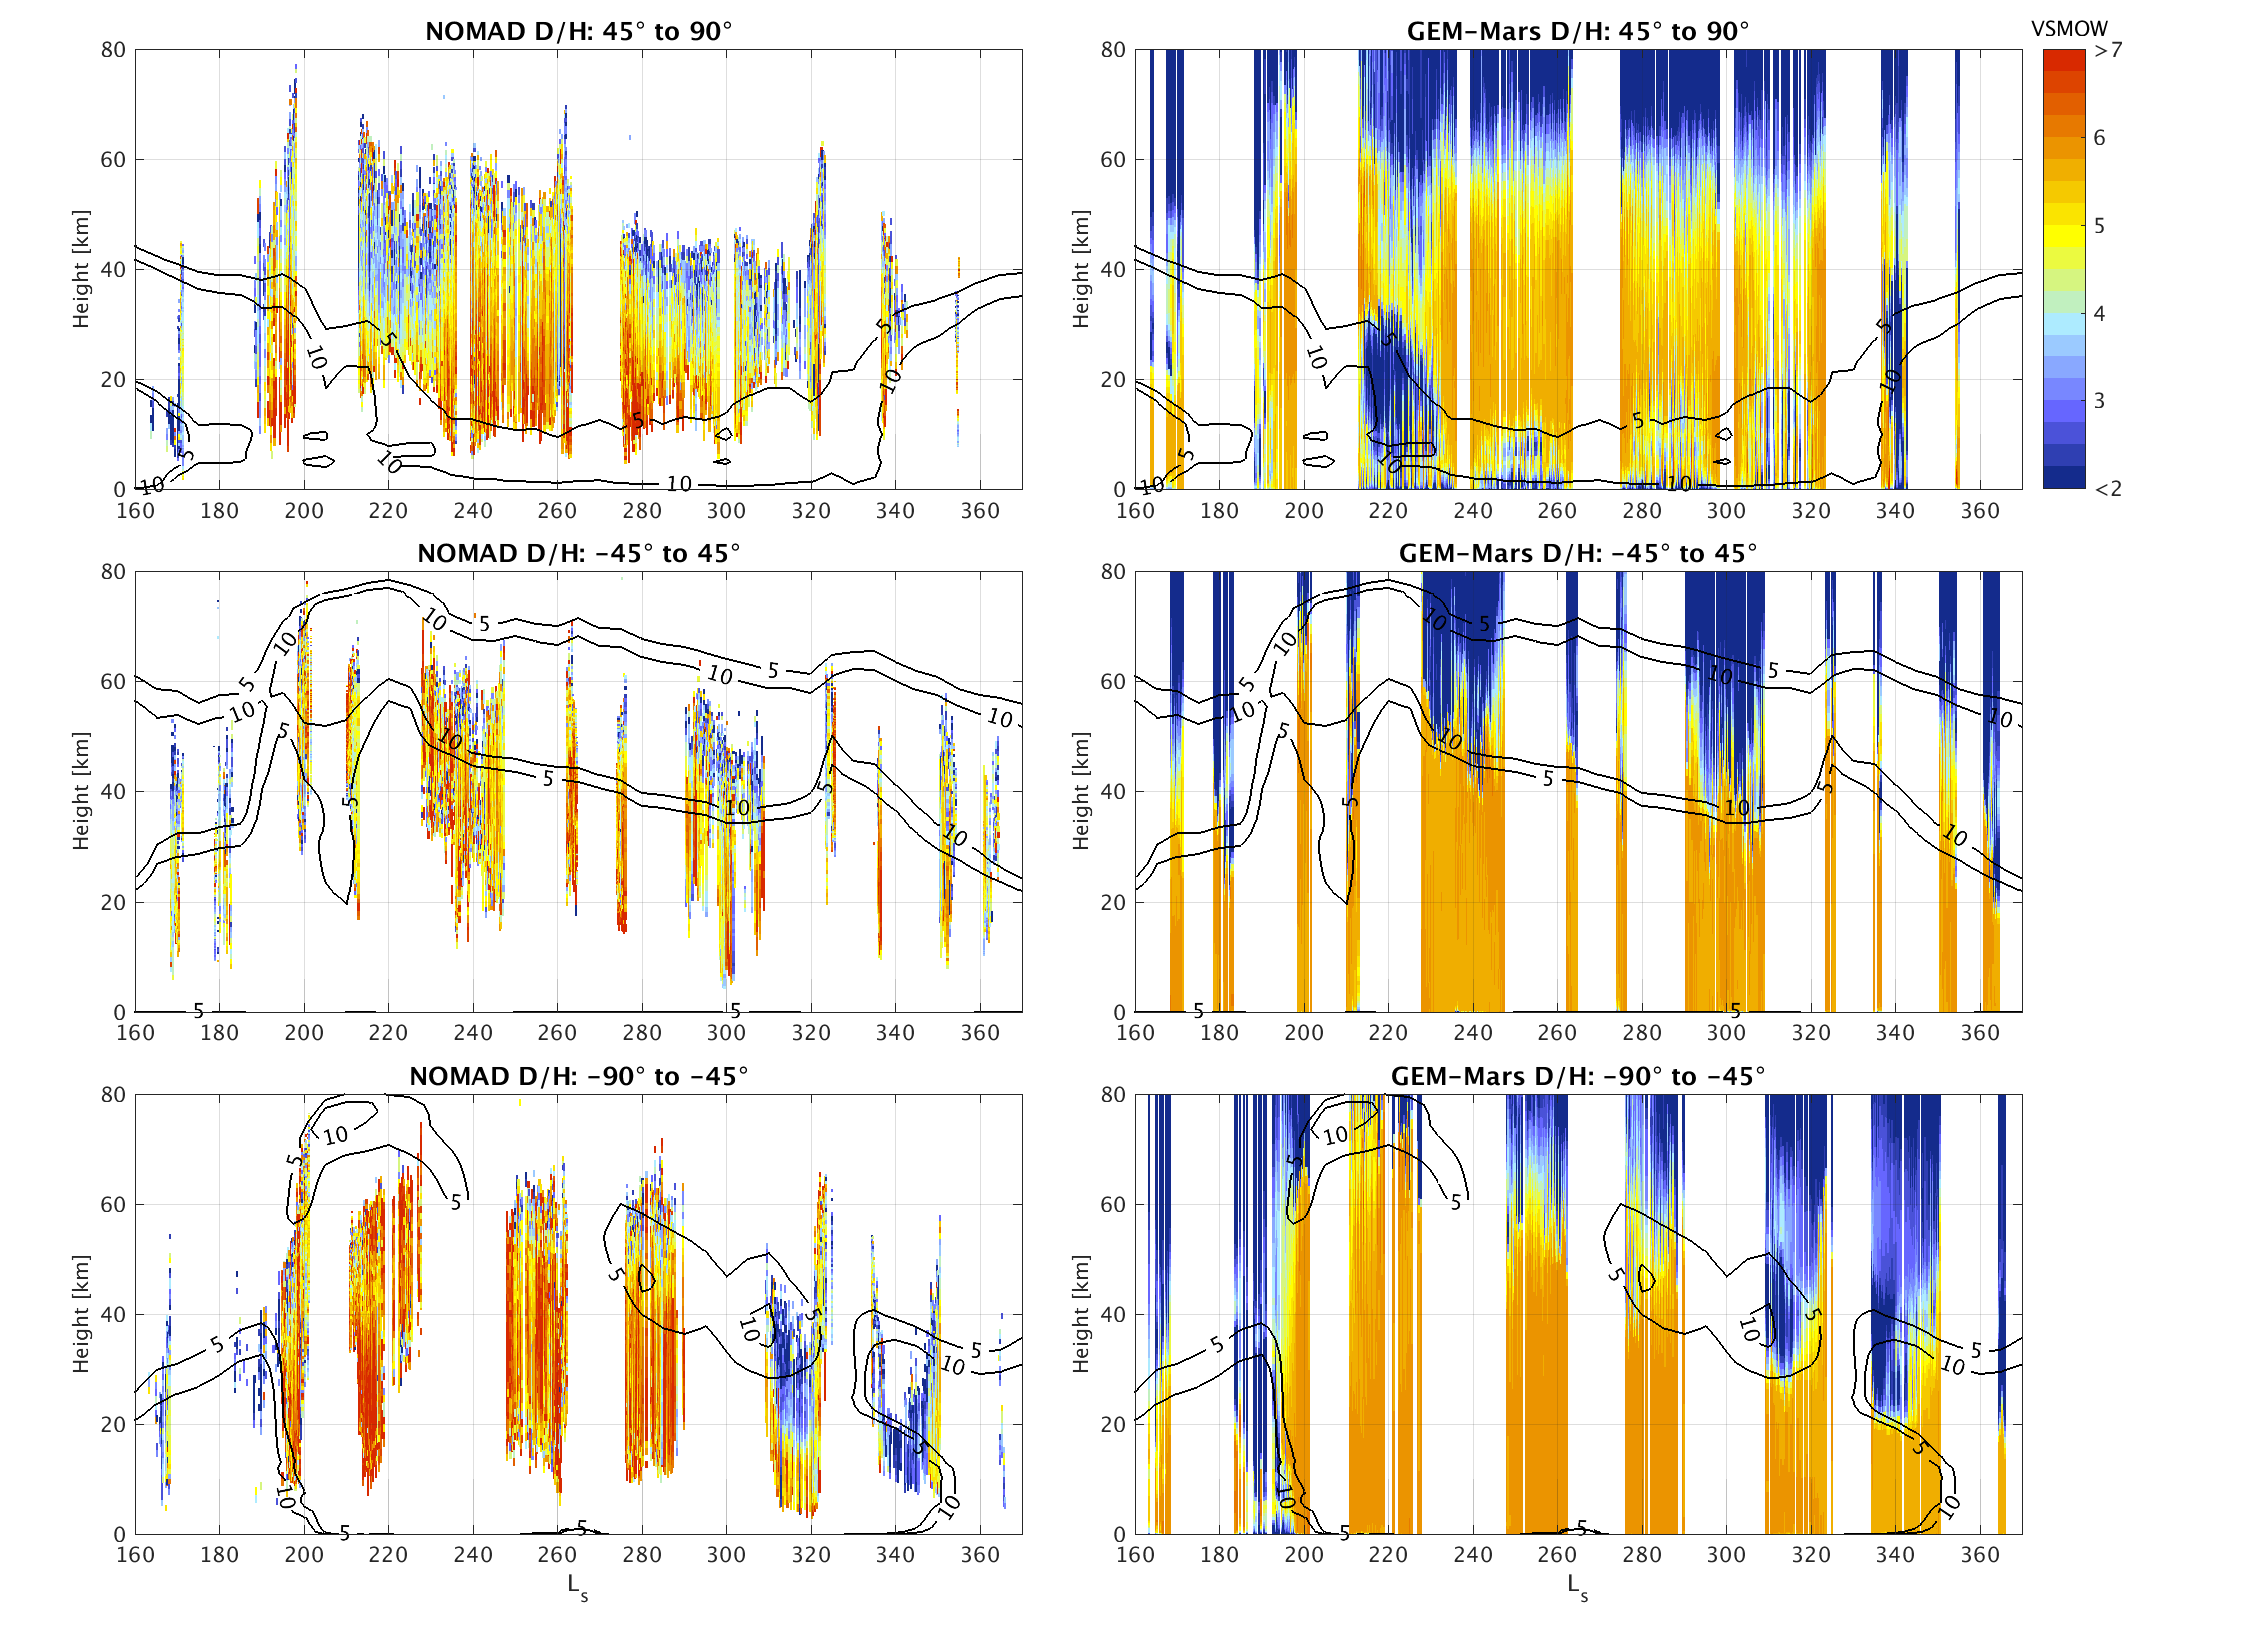
Overview of NOMAD D/H observations (left) and model simulations (right, MY34 simulation) in three wide latitude ranges. The simulation output was interpolated to the time and location of the observations. The black contour lines show the simulated zonal mean ice mass mixing ratio (in ppmm), averaged over the respective latitude ranges, over all local times and over 5° Ls.
https://doi.org/10.1016/j.icarus.2021.114766 and https://arxiv.org
Felix Jungmann, Maximilian Kruss, Jens Teiser, Gerhard Wurm
Dust emission mechanisms as one aspect of wind-driven particle motion on planetary surfaces are still poorly understood. The microphysics is important though as it determines dust sizes and morphologies which set sedimentation speeds and optical properties. We consider the effects of tribocharging in this context as grains in wind driven granular matter charge significantly. This leads to large electric fields above the granular bed. Airborne dielectric grains are polarized in these electric fields, which leads to attractive forces between grains. To simulate aggregation under these conditions we carried out drop tower experiments using tracer particles, mimicking the gas coupling behavior of small dust grains in terms of high surface to mass ratios and efficient gas drag. Under microgravity, the particles are released into an observation chamber in which an alternating electric field up to 80 kV/m is applied. Without electric field no aggregation can be observed on timescales of seconds. However, polarization instantly leads to aggregation of particles when the field is switched on and long chains aligned to the electric field form. Scaled to dust entrained into planetary atmospheres, fine and coarse grain fractions might readily form aggregates after being liberated. Under certain natural conditions, aggregates might therefore start chain-like or at least a chain-like appearance is favored. If atmospheric influences on their stability are small, aerodynamic and optical properties might depend on this.
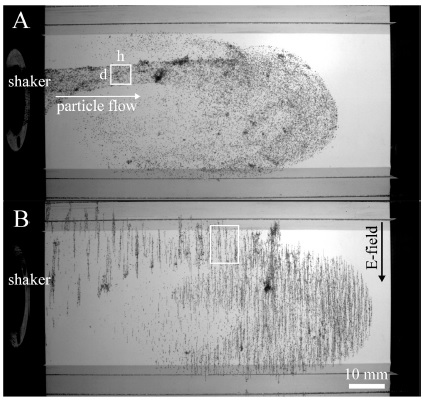
Hollow spheres emerging from the shaker.
JGR Planets (2022) https://doi.org/10.1029/2021JE007065
Paul M. Streeter, Graham Sellers, Michael J. Wolff, Jonathon P. Mason, Manish R. Patel, Stephen R. Lewis, James A. Holmes, Frank Daerden, Ian R. Thomas, Bojan Ristic, Yannick Willame, Cédric Depiesse, Ann Carine Vandaele, Giancarlo Bellucci, José Juan López-Moreno
The vertical opacity structure of the martian atmosphere is important for understanding the distribution of ice (water and carbon dioxide) and dust. We present a new data set of extinction opacity profiles from the NOMAD/UVIS spectrometer aboard the ExoMars Trace Gas Orbiter, covering one and a half Mars Years (MY) including the MY 34 Global Dust Storm and several regional dust storms. We discuss specific mesospheric cloud features and compare with existing literature and a Mars Global Climate Model (MGCM) run with data assimilation. Mesospheric opacity features, interpreted to be water ice, were present during the global and regional dust events and correlate with an elevated hygropause in the MGCM, providing evidence that regional dust storms can boost transport of vapor to mesospheric altitudes (with potential implications for atmospheric escape). The season of the dust storms also had an apparent impact on the resulting lifetime of the cloud features, with events earlier in the dusty season correlating with longer-lasting mesospheric cloud layers. Mesospheric opacity features were also present during the dusty season even in the absence of regional dust storms, and interpreted to be water ice based on previous literature. The assimilated MGCM temperature structure agreed well with the UVIS opacities, but the MGCM opacity field struggled to reproduce mesospheric ice features, suggesting a need for further development of water ice parameterizations. The UVIS opacity data set offers opportunities for further research into the vertical aerosol structure of the martian atmosphere, and for validation of how this is represented in numerical models.
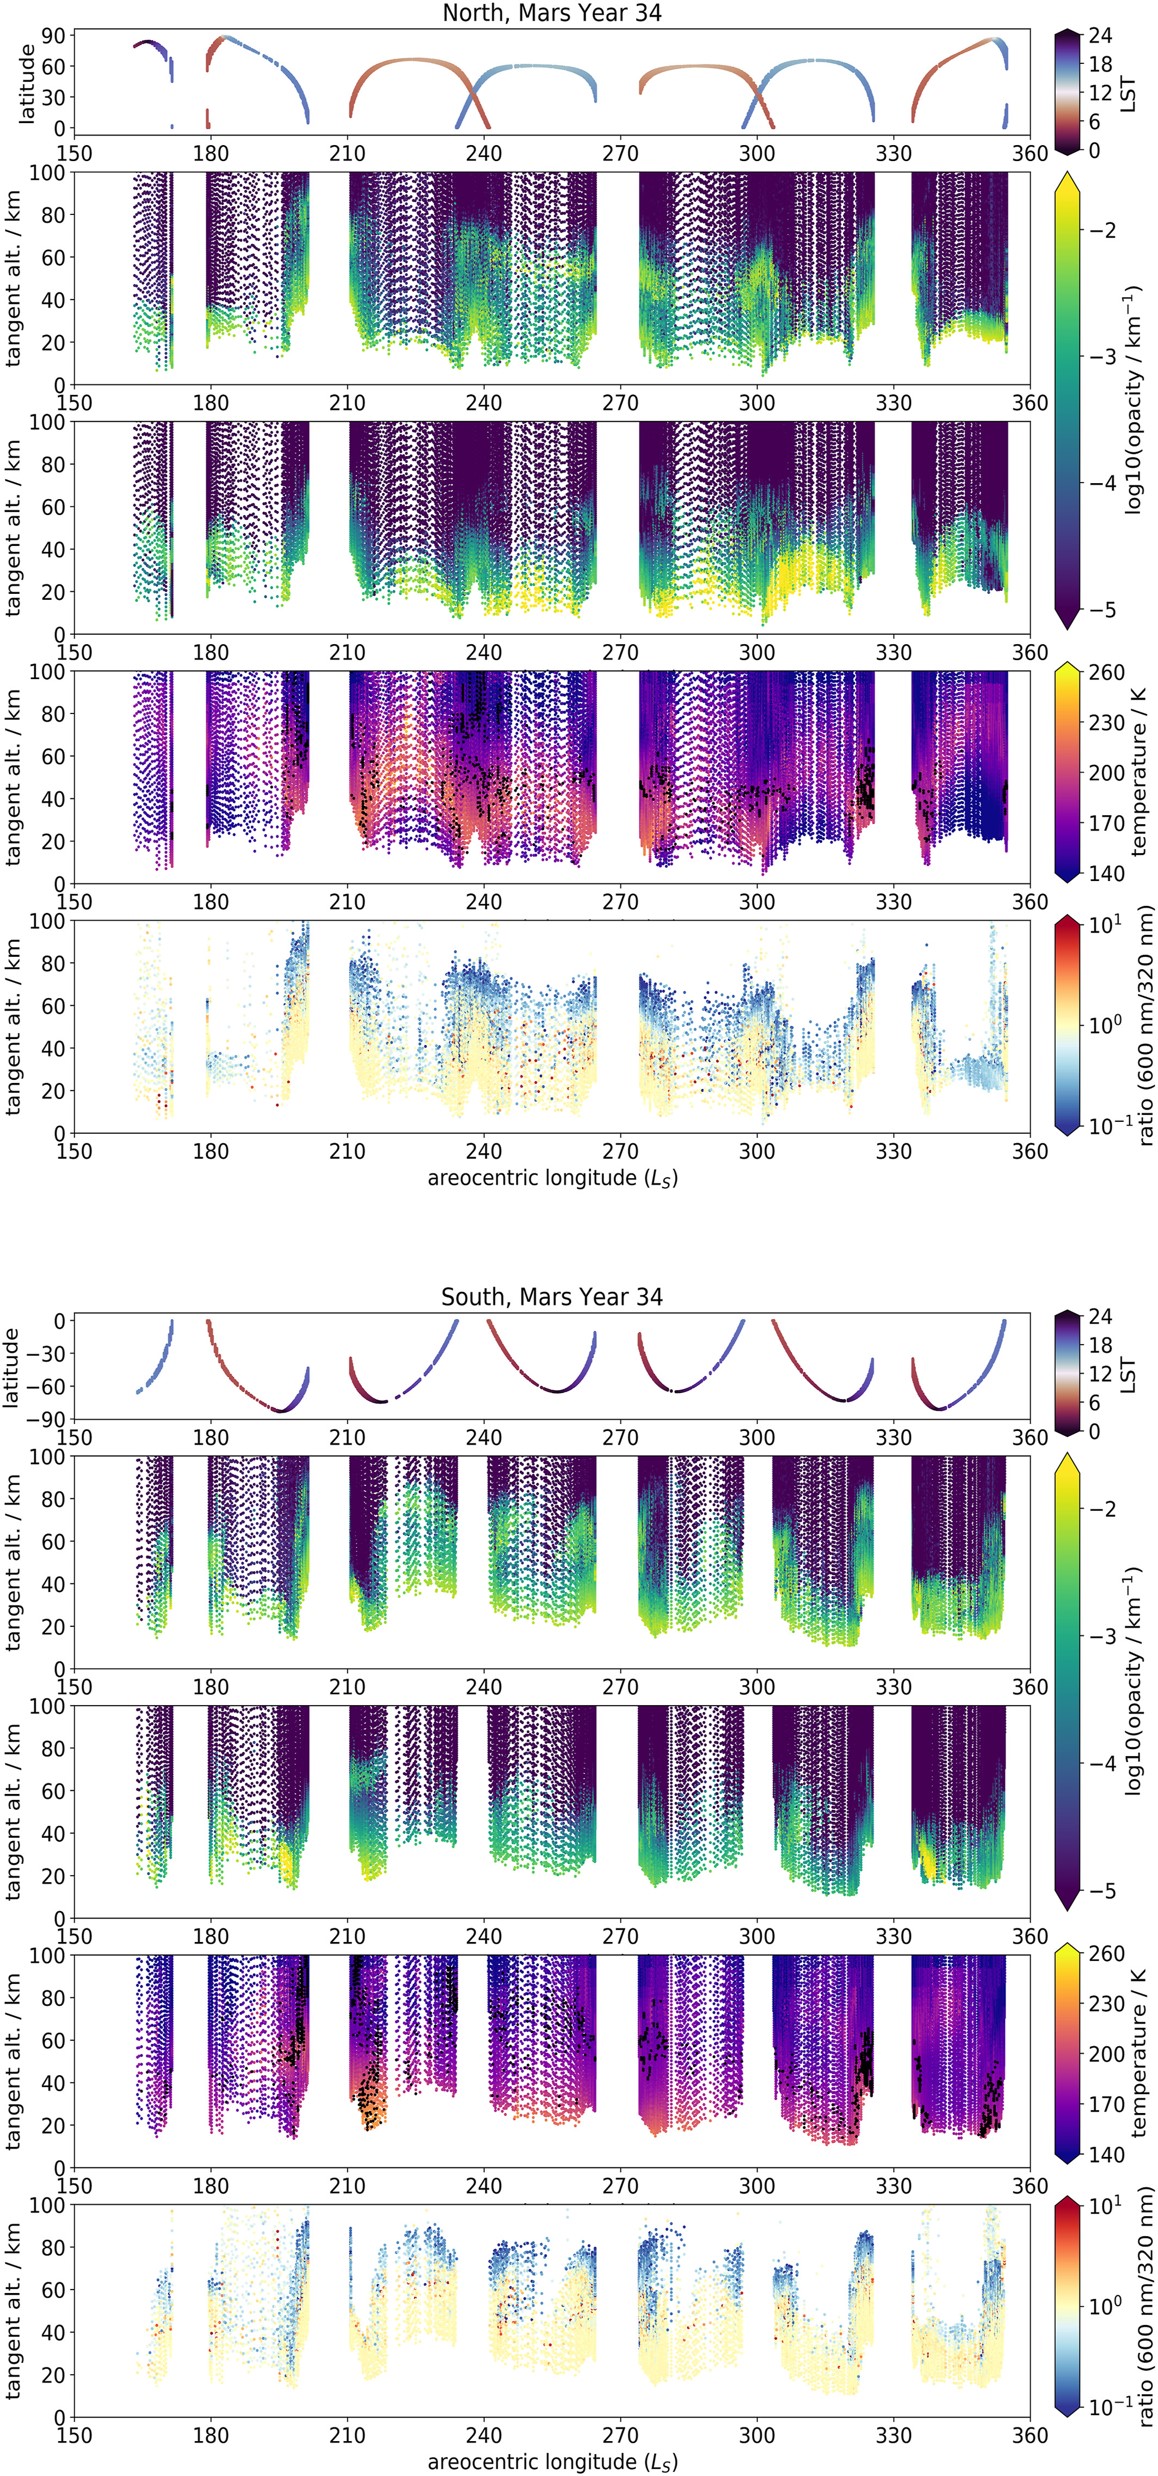
For MY 34 in the northern hemisphere (top five plots) and southern hemisphere (bottom five plots), from top to bottom: UVIS occultation latitude and local solar time distribution; UVIS occultation opacity profiles at 320–360 nm; total (dust + water ice) opacity profiles from the MGCM run with assimilation, matched to the same locations as the UVIS occultations; atmospheric temperatures from the MGCM run with assimilation, matched to the same locations as the UVIS occultations, and overlaid with black dots indicating the approximate location of the hygropause in the MGCM water vapor field, defined here as 70 ppmv (J. Holmes et al., 2021); ratio of UVIS occultation opacities at 600 nm over 320 nm.
Page 4 of 6
- You are here:
-
Home

- Publications